 Nurturing maths awesomeness
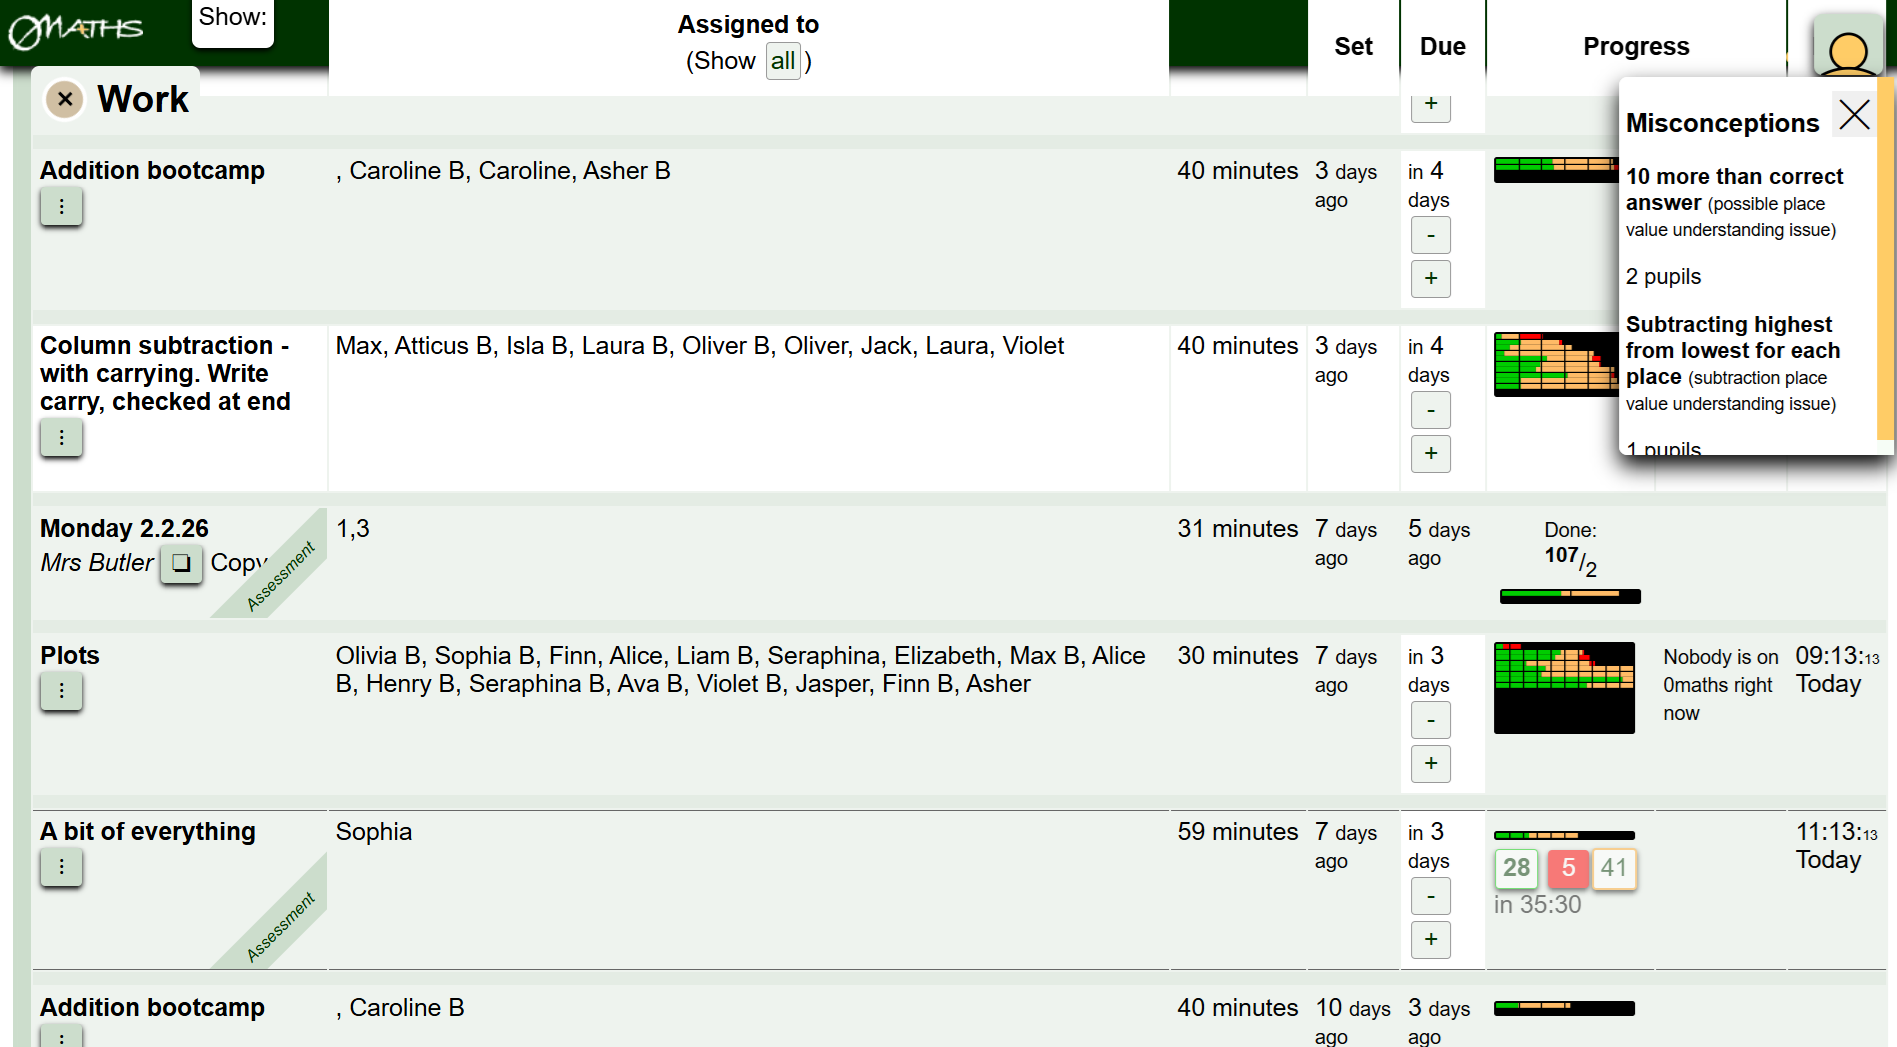
We offer the most comprehensive reporting anywhere. That doesn't mean it's overwhelming. Data is intuitively accessible (click anything for more details), starting with the broadest overview on the dashboard:
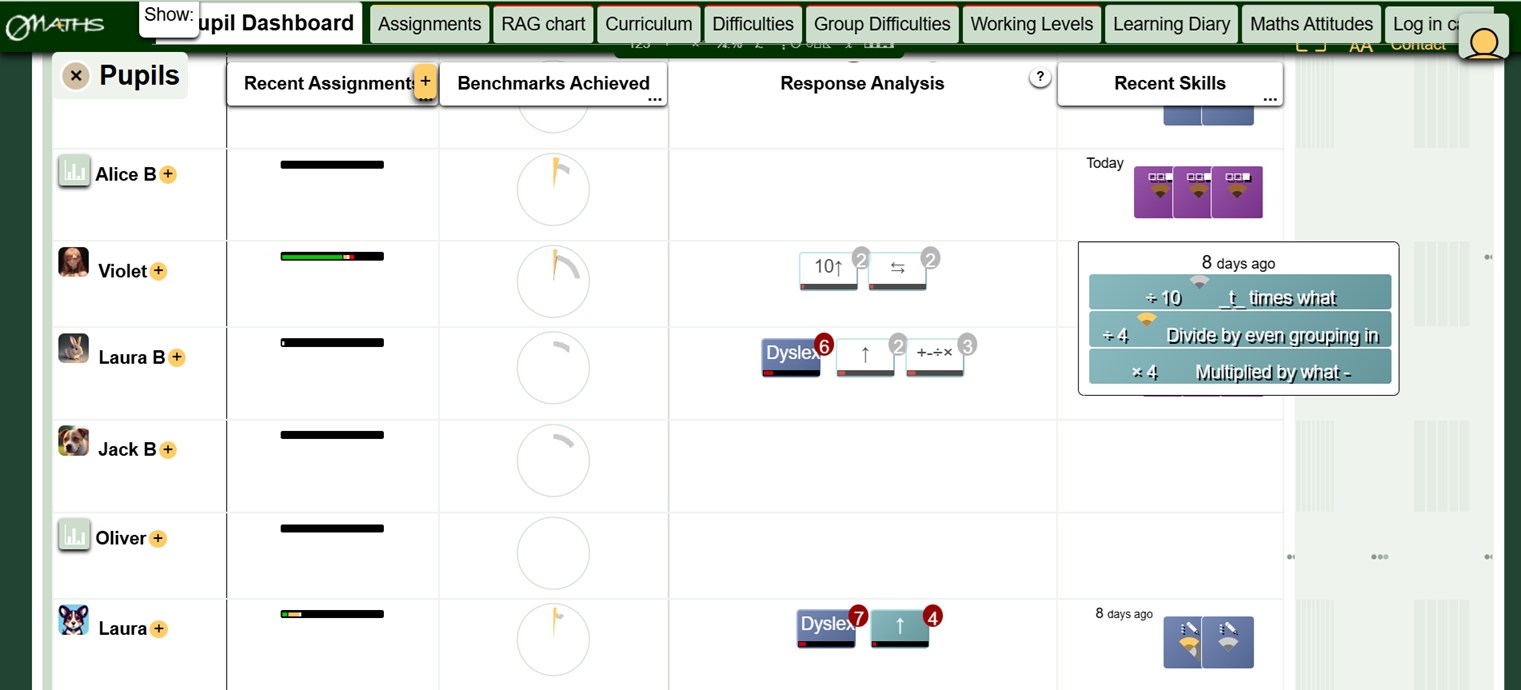
Note the 4th column. Some pupils have some specific types of errors flagged - these may be misconceptions, indicators of inappropriate strategies, or even error patterns consistent with dyslexia and dyscalculia
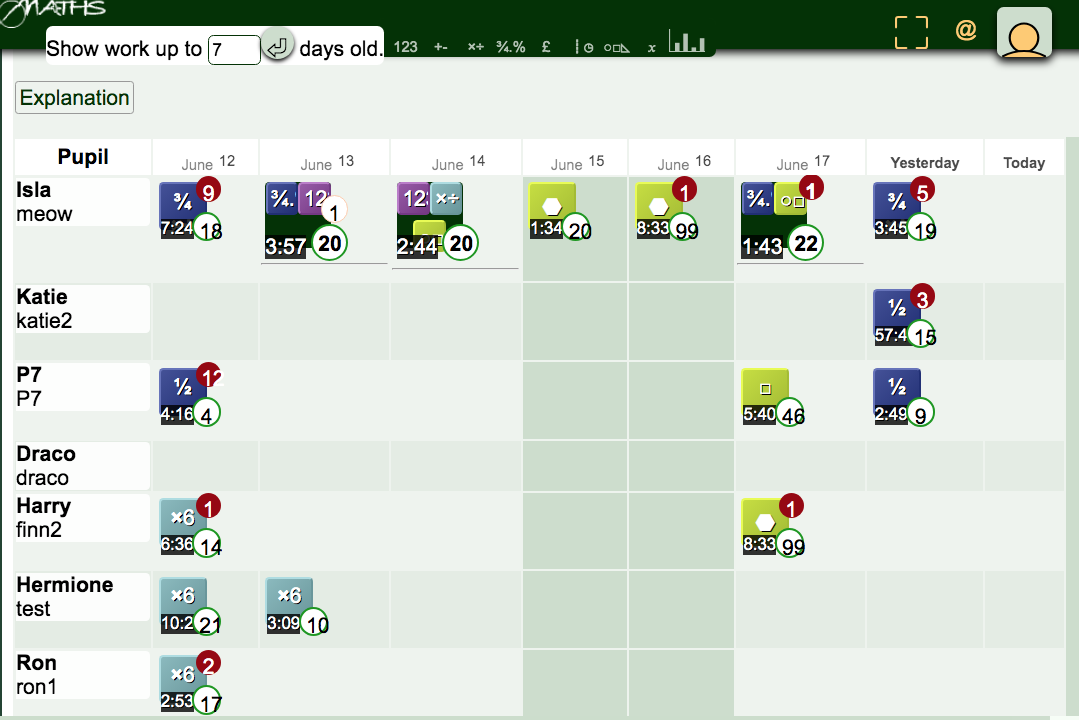
View all pupils' progress in all assignments at a glance, including Live Snapshot to see who's stalled right now, and what they're working on. See how many are acing it, who's strugging, who's stuck and who's grappling with a misconception:
Click an assignment to view progress in as much detail as you need:
- Each question type in the assignment has a pie chart which uses a traffic light system to show you at a glance how well each question has been handled by the group:
Number of students:
answering right first time.
answering right after correction(s).
asking for help.
- The boxes under each pupil show you their progress, with each question showing as a box with a border in the above colour code.
- At a glance you can see whether they've been answering the questions at a stage-appropriate difficulty level (bronze or silver):
At least at target difficultyEasier than target difficulty- A description of the difficulty level the pupil has used is written in the table (eg. with illustration).
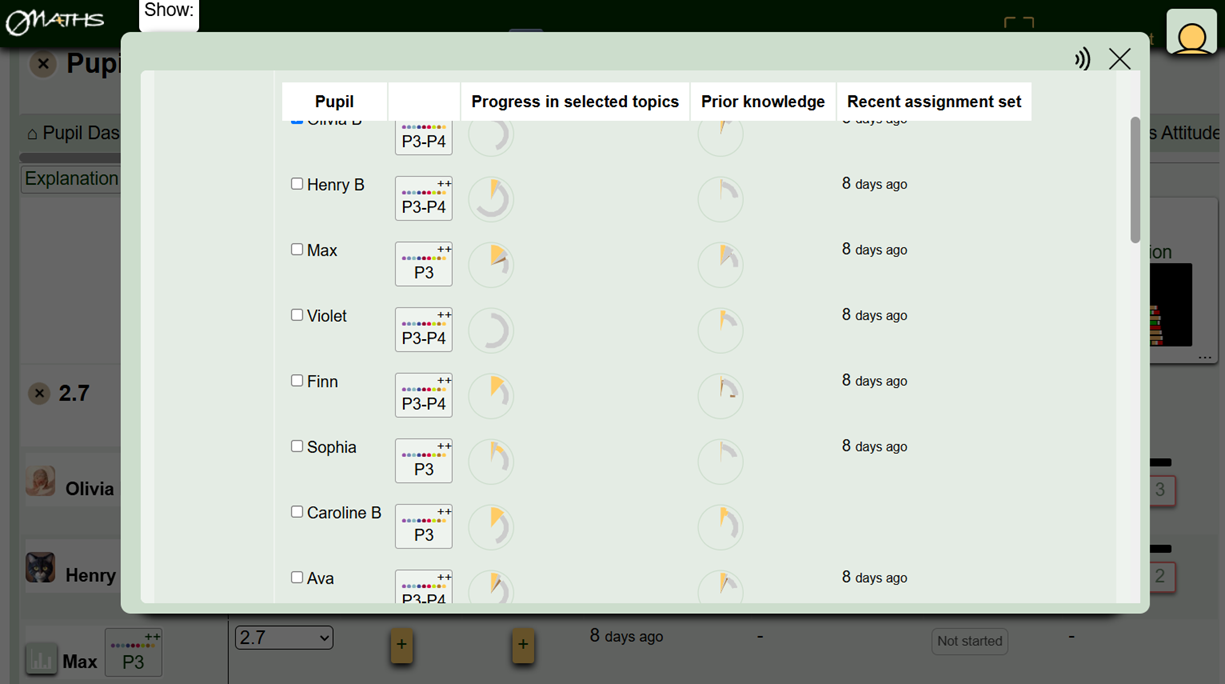
Before even setting an assignment, we can show you how relevant it is to your students, with pie charts showing progress in the selected topics, and prior knowledge:
You can see at a glance how well pupils are doing across the curriculum:
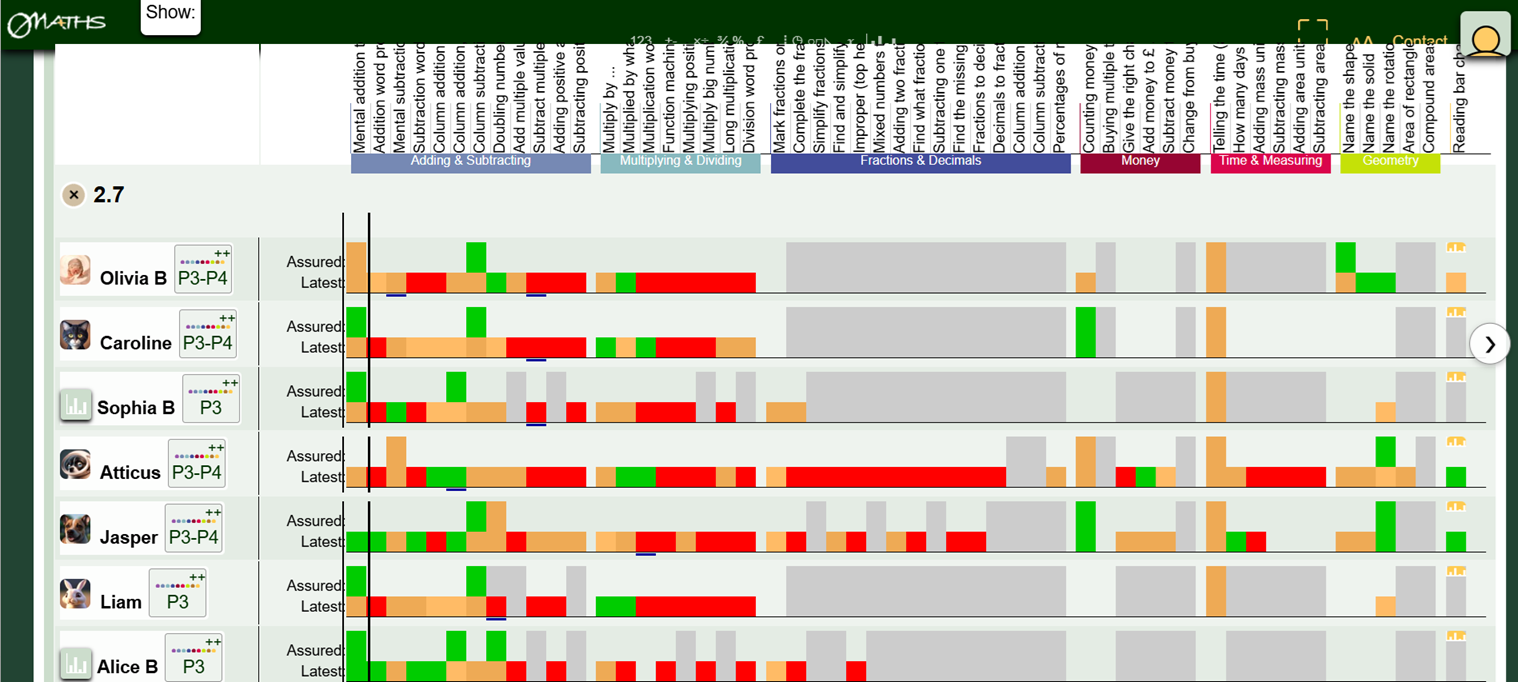
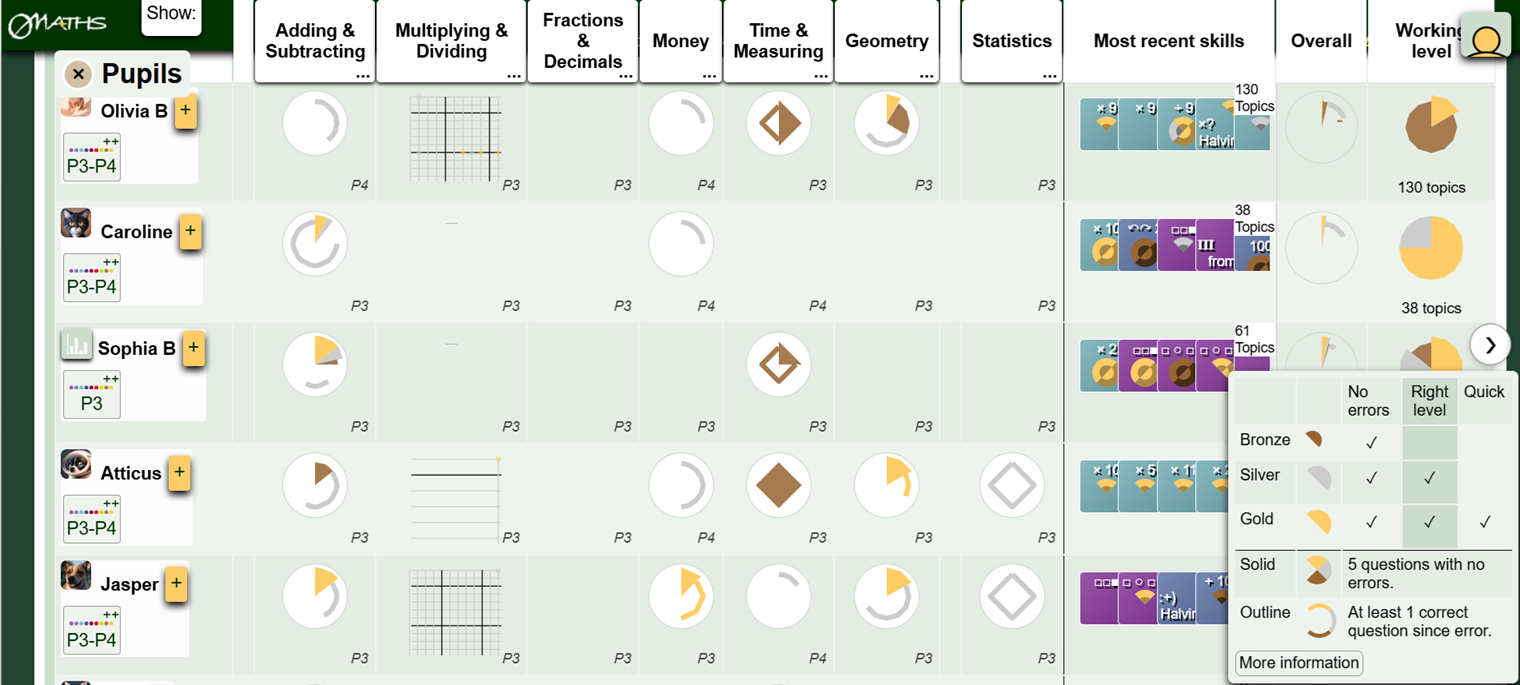
And break it down for more detail:
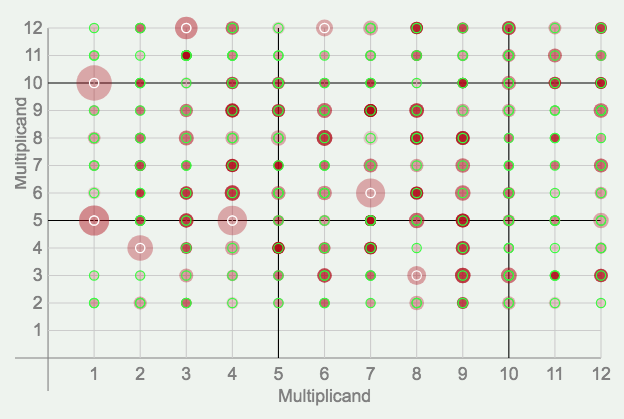
We can also show you multiplication facts progress at a glance:
See pupils' self directed work together with their assignments in their learning diary:
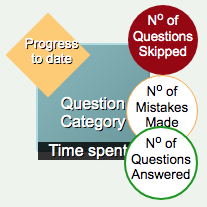
You can see at a glance how many questions they answered, how many they answered with self-corrected errors, how many worked solutions they asked for, and how long they spent at it:
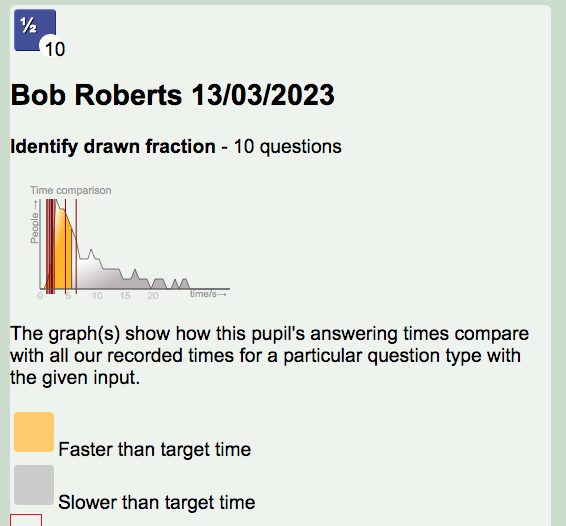
Click a specific task in the learning diary (or in the overall progress section, described below) to view their response speeds against benchmarks and compared to peers:
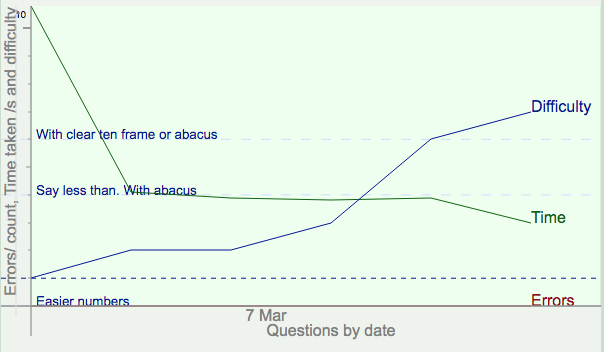
... and each pupil's progress over time, in terms of speeds, errors and help needed:
Data is a bit passion here at 0maths. If you don't see what you need we would be glad to build it for you. Alternatively, you can call us to talk you through it.
© Copyright Influenca Ltd 2020 - 2026